From the 1980s.KvaserHe has been working on CAN products since the beginning of his career, and has more than 40 years of experience in the related product development field, and has a very in-depth research on CAN and related bus technology.
This article comes from kvaser weibo
preamble
In this article, we will introduce how to capture and analyze CAN signals through Microsoft Excel, Notepad, these tools and CanKing, a free software provided by Kvaser.
By using this method to initially analyze the signals, the engineer or learner can gain a better understanding of the inner workings of CAN and J1939, a better understanding of .dbc files, and how other applications use .dbc files. Although the J1939 signal is used as an example in this article, the methodology used here is applicable to any CAN protocol for any signal, including CANOpen, RVC, NMEA-2000, and so on.
Although Excel and Notepad are used here, other Spreadsheet and text editor programs can accomplish such tasks as well.
The disadvantage is that this method has a great limitation, the function is far less than the CAN specialized software. In the case of diagnostic messages, Transport Protocol frames and multiplexed data frames, signal analysis becomes complicated. Therefore, in these cases, users still need specialized CAN analysis tools to correctly analyze the signals in the data stream.
Requirements for the application of this method.
✔️ can acquire raw CAN data in hexadecimal or decimal format and convert the data to .txt file for displaying by Kvaser's CanKing software.
✔️ have Microsoft Excel or similar software and a basic understanding of how to use filters in spread sheet software.
✔️ know what data, .dbc file, or qualifying description to look at, look for the signal you need in the CAN frame, and know how that signal is formatted in the message.
Specific operation steps.
1️⃣ Get the data through CanKing and save it to a text file using Notepad.
2️⃣ Open Excel and import the data into Excel.
3️⃣ Convert data format to different columns
4️⃣ Filter the data to find the CAN frame you need!
5️⃣ Separate data bytes to be analyzed
6️⃣ Convert Data to Graphic Format
7️⃣ Create a chart to show the signals you need
01 ConfirmationCanKing Getting and saving data
To extract J1939 data, you need the Select Formatters dialog box and select the J1939 Formatter by placing this formatter in the Active Formatters section of the dialog box and checking the small box next to it.
This will allow the data to be formatted as shown in Figure 2. When connected to the CAN bus and able to see the data, you can use the Log To Text File window to start and stop data logging, and then save the file to the project's working directory.
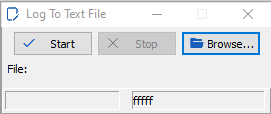
Figure 1 shows the Log To Text File dialog box of Kvaser CanKing, which allows users to get the data they need to analyze. Confirm whether you are connected to the CAN bus or not, by selecting the Start Run button in the main window of Kvaser CanKing, you can view the data in CanKing, and the data you need will be displayed in the Output Window of CanKing.
When you view the data using a text editor, such as NotePad, the data will look like this.
WinNo P PGN SA DA Flg Len D0...1...2...3...4...5...6...D7 Time Dir
CAN 1 6 0F009 0B->* 8 7D 7A 60 83 7D 4F 7D 7D 7D 217.088350 R
CAN 1 3 0F004 00->* 8 60 7D 84 50 14 00 F0 84 217.093810 R
CAN 1 6 0F009 0B->* 8 7D 7A 60 83 7D 4F 7D 7D 7D 217.097340 R
CAN 1 3 0F004 00->* 8 60 7D 84 50 14 00 F0 84 217.104820 R
CAN 1 6 0F009 0B->* 8 7D 7A 60 83 7D 4F 7D 7D 7D 217.107600 R
CAN 1 6 0FEF1 31->* 8 F7 FF FF CF FF FF FF FF FF 217.111110 R
CAN 1 7 0FF05 8A->* 8 00 FF FF FF FF FF FF FF 217.113450 R
CAN 1 3 0F004 00->* 8 60 7D 84 54 14 00 F0 84 217.114870 R
CAN 1 6 0FEE0 27->* 8 FF FF FF FF FF AC A8 06 00 217.115440 R
CAN 1 7 0FEC3 27->* 8 FF FC FF FF FF FF FF FF 217.116020 R
CAN 1 6 0FF6F 8A->* 8 E2 14 E0 15 A0 12 FF 5E 217.116570 R
CAN 1 6 0F009 0B->* 8 7D 7A 60 83 7D 47 7D 7D 217.117580 R
CAN 1 3 0F004 00->* 8 60 7D 84 54 14 00 F0 84 217.126930 R
CAN 1 6 0F009 0B->* 8 7D 7A 60 83 7D 47 7D 7D 217.127770 R
CAN 1 6 0FF60 4D->* 8 00 00 00 00 FF FF FF FF FF FF 217.131710 R
Figure 2 Example J1939 data obtained through CanKing.
In this example, all CAN frames have 8 data bytes. The signal to be analyzed is a 10 ms periodic signal and the data is plotted on a graph for a few seconds. At this point, you should want to save the analyzed data in a .txt file in your computer's working directory.
02 Importing data into Excel
The goal of this step is to add your data to Excel so that you can work with them using filters and select the data to analyze. If other spreadsheet applications have filters, functions, and plotting capabilities similar to Excel's, they can be used as well.
Open a blank Microsoft Excel spreadsheet and select Folders → Open → Browse.
In the lower right corner of the navigation box, select All Files (.) (All Files) to open the .txt file. Search your working directory and locate and select the .txt file you created in step 1 above. Your display will basically look like the image below:
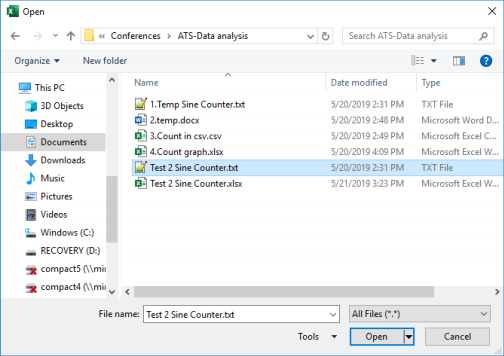
Select the .txt file you created in Step 1 and open it.
03 Converting data format to different columns
When you select your .txt file and open it in Excel, you will see the Text Import Wizard shown in Figure 4. Regardless of how you import CAN data into Excel, you must edit your data and/or headings to present it as a visual chart.
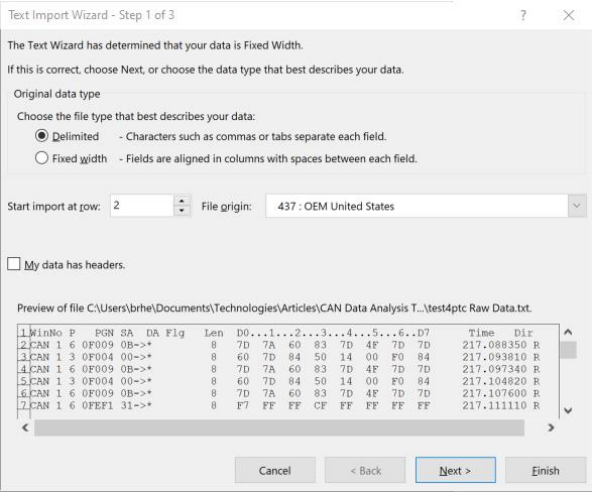
The following can help you quickly convert .txt data to Excel format:
1️⃣Under Choose the file type that best describes your data: select Delimited.
2️⃣ Next to the line Start import at row: Select the CAN data that contains the first row; in this example, the second row.
3️⃣ Click Next >.
4️⃣ Select Space in the second box below Delimiters.
5️⃣ click Next >.
6️⃣ Click Finish
Open the Excel worksheet and display your CAN frames in multiple columns showing the identifier, Flag, DLC, and data fields, as well as the time and direction columns. If you make each column header above the data, make sure the column headers correspond to the data correctly. Sometimes the column headings are misplaced by 1-2 columns during the conversion process. (Headers are recommended)
The column headings I use are Type, Ch, Pri, PGN, SA/DA, DLC, D1, D2, D3, D4, D5, D6, D7, D8, Time, and Dir. Below are the first few rows of the worksheet after adding the column headings as shown.
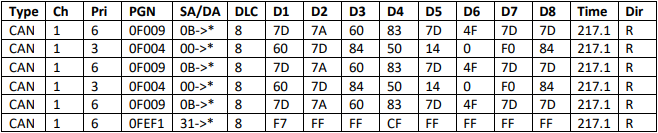
The data contains only 8 bytes of frames, so all the data is below the first row of headers. If some frames in your data have different DLC data link connectors, the data may be a bit more complex. Don't worry, because only one PGN is drawn at a time.
04 Filtering data to find meaningful CAN frames
This step requires that you know what data you are looking for and where that data is located in the CAN frame. In J1939 and other CAN protocols, the data in a CAN frame usually carries multiple signals, and different protocols name the messages and signals differently. In J1939 communications, a signal is an informal name for an SP or suspect parameter.
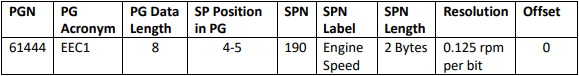
In the example, an Engine Speed signal will be analyzed. Details of this signal can be found in the Digital Annex to SAE J1939DA.
Engine Speed is labeled SPN 190 and the chart below shows the details in the numeric attachment:
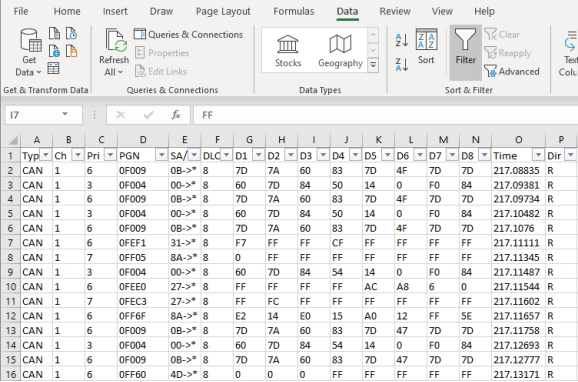
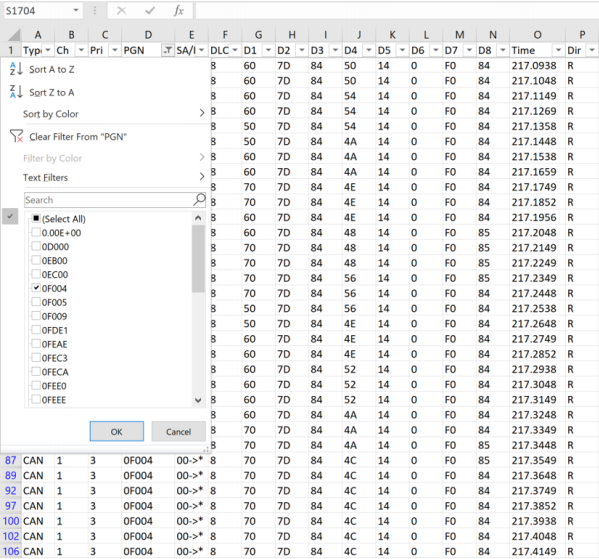
If you haven't used Filters in Excel before, click on the Data tap at the top of Excel and find Filter. select the first row of data (the header row) and choose Filter, you will see small boxes in the first row of each column of the worksheet with a downward arrow in each box. Select the arrow on the PGN column and you will see a box as shown in Figure 7.
Do not select Select All, just select the message to be filtered, the example is 0F004.
After selecting OK, the data you want to view will be filtered. The worksheet now shows only the CAN frames you have selected - they contain the SPN 190, the report of the engine speed operation.
05 Separate out the data fields to be analyzed
The worksheet shows only the CAN frame data you selected, now to sort out the signals we want.
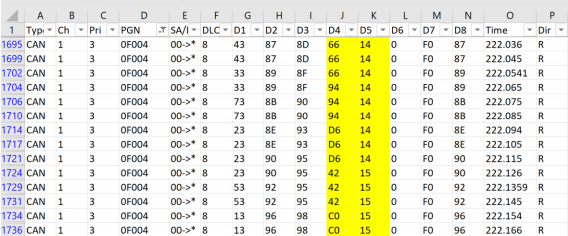
Returning to Table 1, we can see that Engine Speed is a double byte signal at position 4 and position 5 (columns D4 and D5). Since this is a double byte signal, we must consider the byte order before performing any calculations on this data.
Figure 8 shows a portion of our filtered data, with D4 and D5 highlighted in yellow. Just by looking at the data, it is easy to see the byte order. We can see that the lowest valid byte is in D4 and is transmitted first, mainly because it is the most variable byte, and we can see that D5 is pushed up by 1 when it is variable.
If you look at the first row of data in Figure 8 and see Engine Speed as a unit number, you can write the hexadecimal value for Engine Speed as 0x1466. separate out PN 190 in the data captured by the CAN bus. and is shown in columns D4 and D5 as PGN 0x0F004 or PGN 61444.
In some cases, some SPNs are smaller than a byte and they are grouped together with other SPNs in the same byte. In this case it is necessary to use more Excel functions such as masking and shifting.
Worksheets provide many mathematical functions that can be customized to manipulate data and create data charts the way you are used to.
06 Converting Data to Chart Mode
The remaining resolutions and offsets that must be considered before a chart can be drawn. Resolution is the term used in SAE J1939DA to refer to the scale factor to be used in the representation of a signal and displayed in an understandable manner.
If you are using Kvaser Database Editor 3 software, the term to use to extract this information from a .dbc file is Factor . The display resolution is equal to 0.125 rpm/bit and the offset is equal to zero. Calculate the engine speed in RPM using the initial data as follows:
1️⃣ Convert the two-byte SPN 190 to a decimal number, e.g. 0x1466 = 5,222.
2️⃣ This number is multiplied by the resolution - or zoom ratio: (5,222 bits) x (0.125 rpm/bit) = 652.75 rpm
3️⃣ plus the offset, here the offset is zero, so the resulting value is 652.75 rpm
Using the worksheet, it is easy to standardize the signal samples to be drawn. The first thing to do is to add a blank column to the right of column D5. With this column, it can be used to calculate the RPM by following the steps above.
If you are not sure about this procedure, you must first learn about Excel's function function, which is to go to a blank cell and type “=”, then click fx in the menu bar. because the data is in columns J and K, you have to enter the function in the first small box in the new column below the header row:
=HEX2DEC(CONCAT(K3,J3))*0.125
Concatenate the two bytes of data in the correct order (first K3, then J3), convert from hexadecimal to decimal, and multiply by our scaling value.
07 Create charts to display data
We just need to use Excel's plotting functions to plot the data chart. The columns to graph are the ones you create using the concatenate (CONCAT) function and the hexadecimal to decimal (HEX2DEC) conversion function.
You can choose to create a whole column in step 6, or just a part of it. Next, select Insert from the menu bar, choose Insert Line or Area Chart, and you're ready to display your chart. The resulting chart is shown in Figure 9.
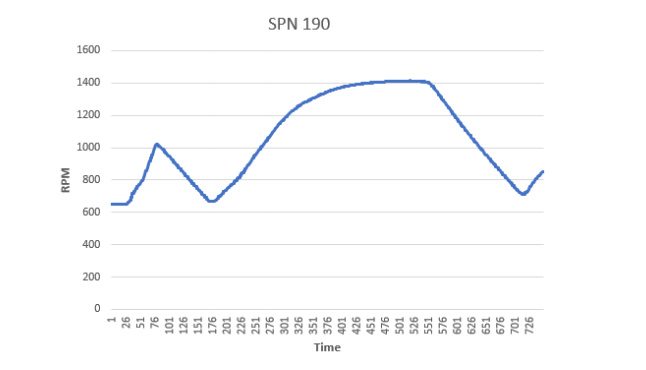
This diagram is SPN 190, the worksheet provides useful functions and methods to create the graph, and through the Insert Line or Area Cart to create this diagram, in a variety of ways to display the different signals, these steps can help engineers or technicians, using the function to analyze the data of the CAN bus.
Conclusion
This article uses non-specialized software tools to assist in understanding the signals in the CAN data stream. We hope that this approach will help you to more easily understand how CAN data can be analyzed.
Contact Us