The ability of Time Sensitive Networking (TSN) to merge the OT and IT worlds is an innovative technology that will truly ensure interoperability and standardization. Effective development of this technology will significantly reduce equipment costs, maintenance, seamless integration of advanced analytics services, and dependence on a single vendor. In order to achieve certainty in these networks, it is necessary to control the latency and bandwidth of the devices connected to the network and to predict their behavior under congestion and error conditions.
RELY-TSN-LAB is a new concept test tool that measures the delay and bandwidth of a device or TSN segment under different test conditions.
01 Access in the network
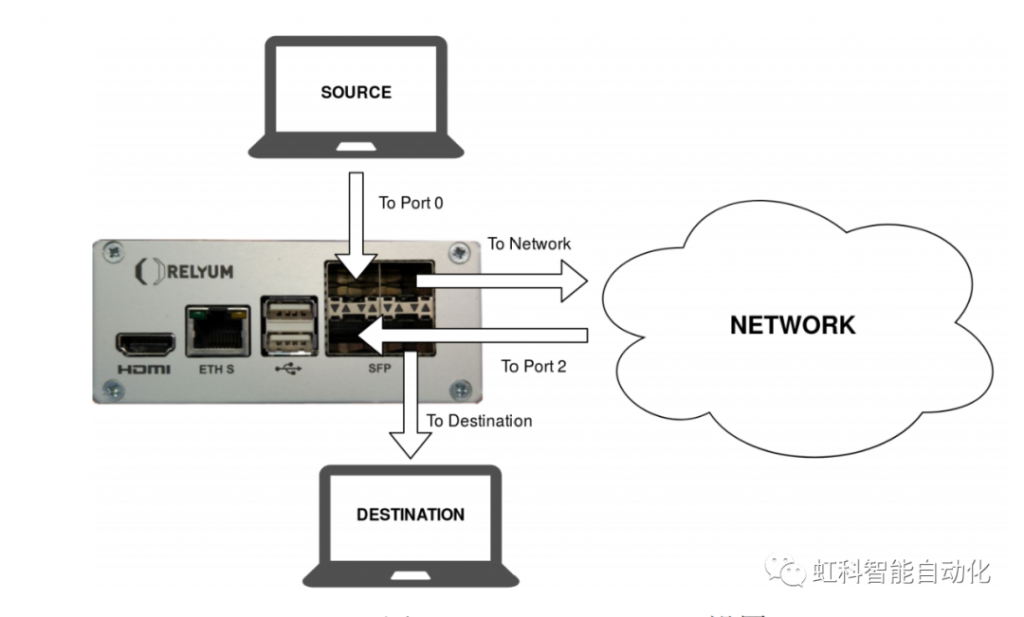
The first step to start using RELY-TSN-LAB is to connect the device to the LAN segment or to the device under test. RELY-TSN-LAB performs all operations on frames received from port 0 and forwards them to ports 1 and 2 in the same way, but the frames are forwarded to port 3. All traffic received on ports 1 and 3 is passed to ports 0 and 2 respectively without any change. The block diagram implemented in RELY-TSN-LAB is shown in Figure 1.
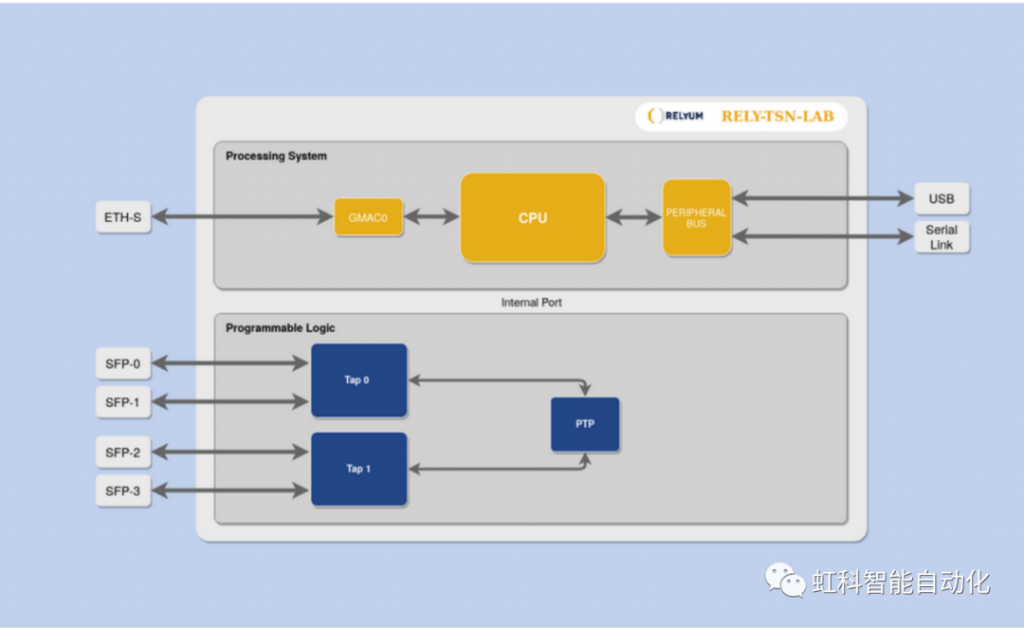
PL Section
The programmable logic part of the SoC is composed of two labtool blocks that perform the functions of filtering, error injection, bandwidth metering and delay metering. The first Labtool injects traffic into the LAN segment or device under test through port-0 and port-1. The second Labtool operates through port-2 and port-3 to get traffic from the LAN segment or the device under test. In addition, both modules are connected to a third module for corresponding synchronization for time stamping purposes.
PS section
The processing system portion of the SoC, which is connected to the PL portion through an internal configuration interface. It also has an external connection called the service port, which can be used to configure the device and retrieve stored .CSV files. The service port can be set up in a different network than the other Ethernet ports.
The proposed test setup is shown in Figure 2. Traffic can be marked, measured, or damaged before it enters the network under test and again before it reaches its destination.
REL-TSN-LAB is transparent to all traffic (except when error injection is enabled). Only a delay of about 1us is added. This delay is symmetrical in both directions. This allows the path delay to be measured without asymmetry for synchronization purposes.
02 Basic Function Test
Network Topology Model
As shown in the network topology model below (see Fig. 3), here a traffic generator (GEN) is used as the data source to send traffic, a PC is used as the destination, a switch (BRIDGE) is used to simulate a large-scale intermediate node, and the device LAB is used to measure the bandwidth of the traffic transmission between the data source and the destination, as well as the delay.
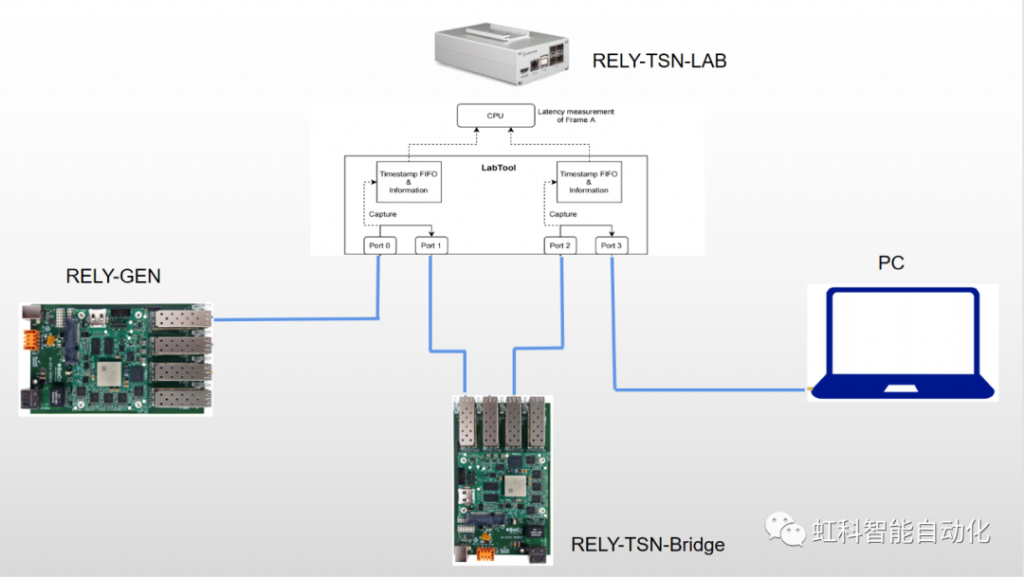
Note: It is also possible to send many different types of traffic to the destination PC through the switch using GEN Remaining Ports. By configuring the filtering policy, the bandwidth and transmission delay of different traffic can be measured based on different parameters (IP address, Ethernet type, content, etc.) restrictions.
GEN Definition of Transported Traffic
Use the Traffic Generator to generate traffic transmissions to capture this traffic class in the REC with the GEN transmission parameters set as shown in Figure 4.
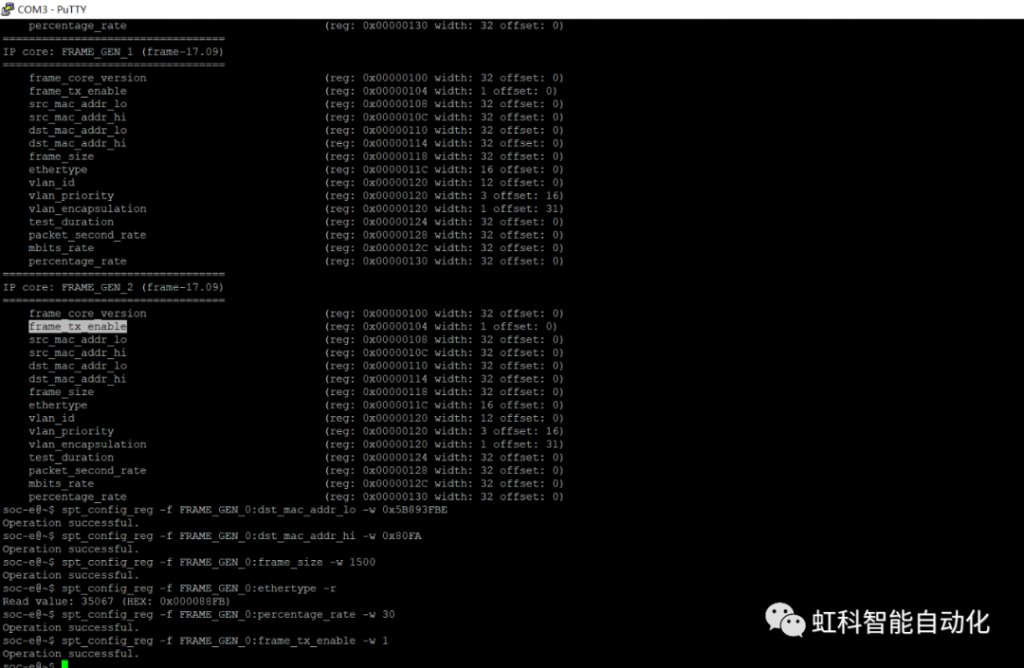
dst_MAC_address_lo: This MAC address is used by the device as the destination address for any outbound frames generated. These bits correspond to the low part of the MAC address (bits 31 through 0). Set to 0x5B893FBE for the target PC.
dst_MAC_address_hi: This MAC address is used by the device as the destination address for any outbound frames generated. These bits correspond to the high portion of the MAC address (bits 47 through 32). Set to 0x80FA for the target PC.
Frame Size: It specifies the length of the frame to be transmitted. This size increases from 60 bytes to 1518 bytes (without CRC field). Defined as 1500 bytes in size.
Ethertype: It specifies the ether type of the frame to be transmitted. The default value is 0x000088FB.
Percentage: It defines the transfer rate in percentage, which is granular in one unit. It is defined as 30% of a gigabit, i.e. 300 megabits.
Frame_tx_enable: set to 1 to enable packet transmission.
Bandwidth measurement of LAB equipment
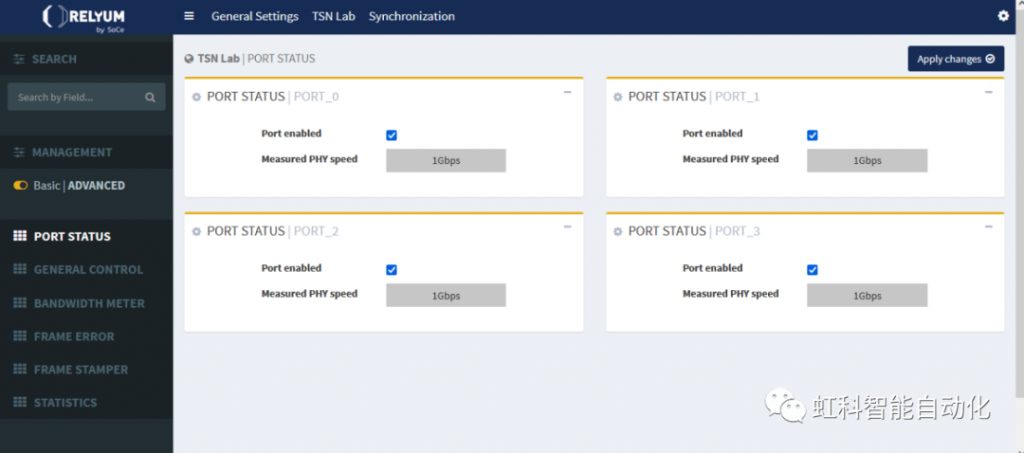
Figure 5 shows the status of each TAP port, check “port enabled” to enable the TAP port. In addition, the measured speed of PHY is also shown for each port.
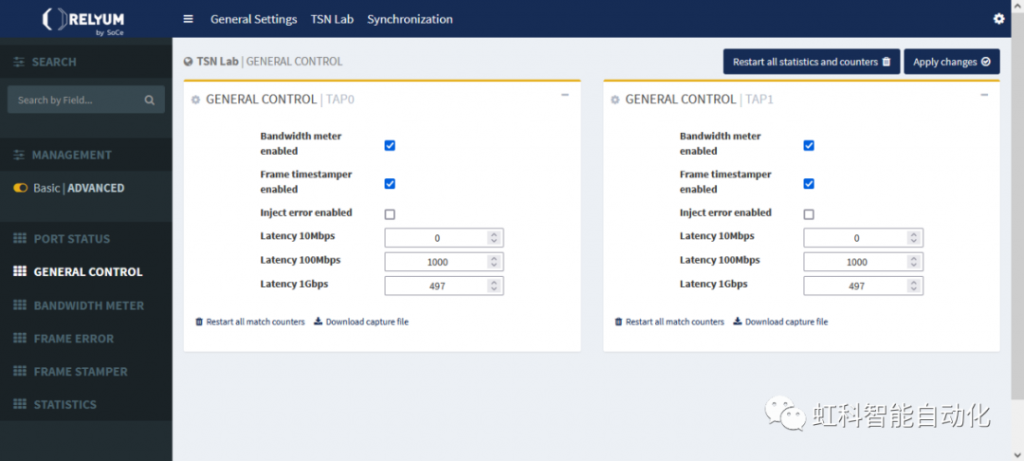
As shown in Figure 6, check “Bandwidth meter enabed” to enable the bandwidth meter function of LAB device, which can calculate the bandwidth of the traffic passing between two TAPs.

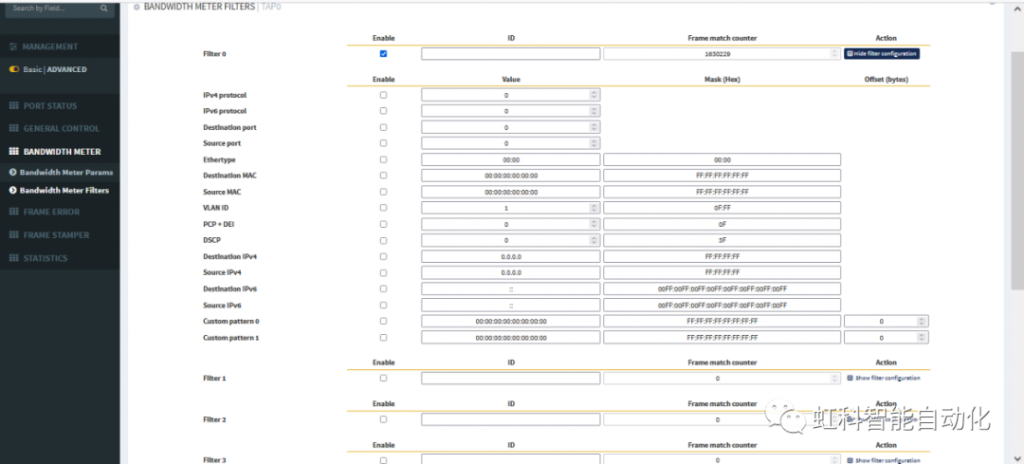
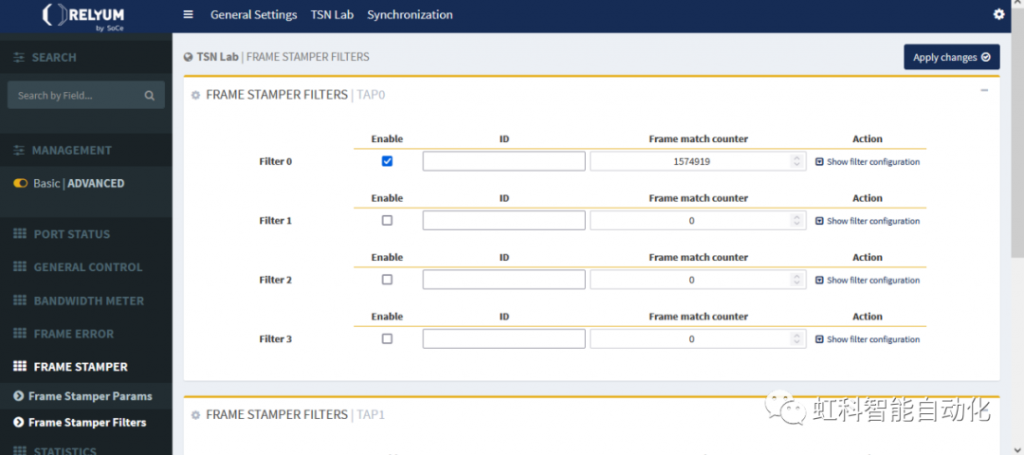
As shown in Figure 7, select the frames on which you want to apply the bandwidth metering function by using the filters. Up to 4 filters can be configured, each of which can be identified by a user-set ID. Next to its ID, there is a counter for measuring the number of frames matching the filter set. The filters will be applied when the corresponding Enable checkbox is selected and the Apply Changes button is pressed.
Note: This uses the global filter (no filter parameters are set, only the filter is enabled)
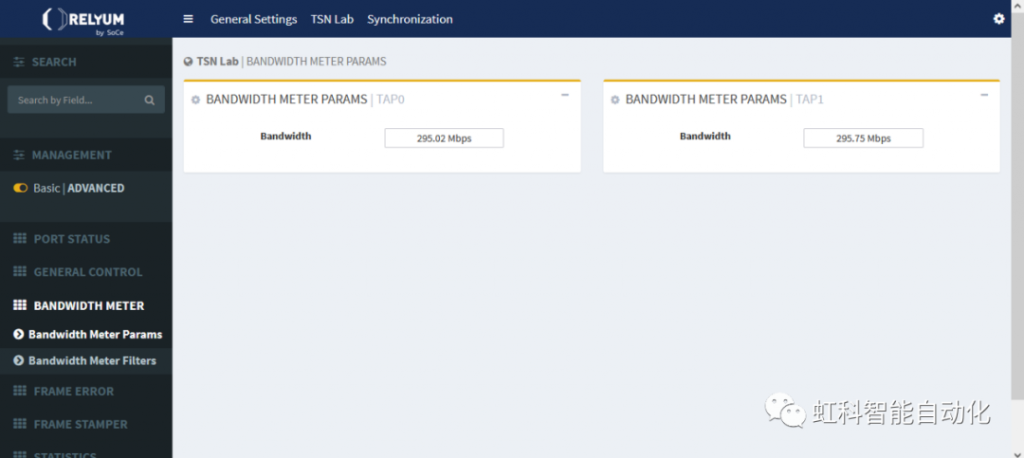
After the bandwidth measurement function and filter parameters are set and activated, as shown in Figure 8, you can see the detected traffic bandwidth of TAP0 and TAP1 in the “BANDWIDTH METER”, which are both 300M in size, which is in line with the size of data transmission set by the traffic generator (GEN).

Each port of the device records transmitted and received frames according to different standards. These counters are wrap-around counters with a reset function. They can be reset to zero when they are naturally looped, reset, or restarted. All statistical counters are read-only, so write attempts to the statistical counters will be unsuccessful.
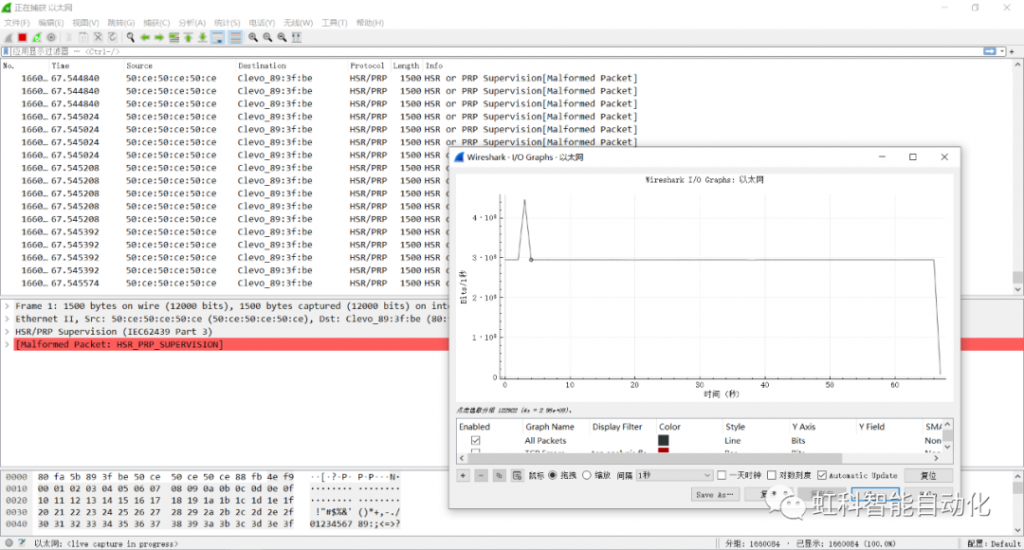
In order to check whether the traffic received by the destination PC is incorrect or not, the wireshark tool is utilized at the PC side to capture the transmitted traffic, as shown in Fig. 10. Through parsing the traffic message and the I/O statistics of bandwidth, comparing with the GEN parameter configuration, the captured traffic is consistent with the transmitted traffic, which proves that the LAB device acts as a transparent device in the network.
Latency Calculation for LAB Devices
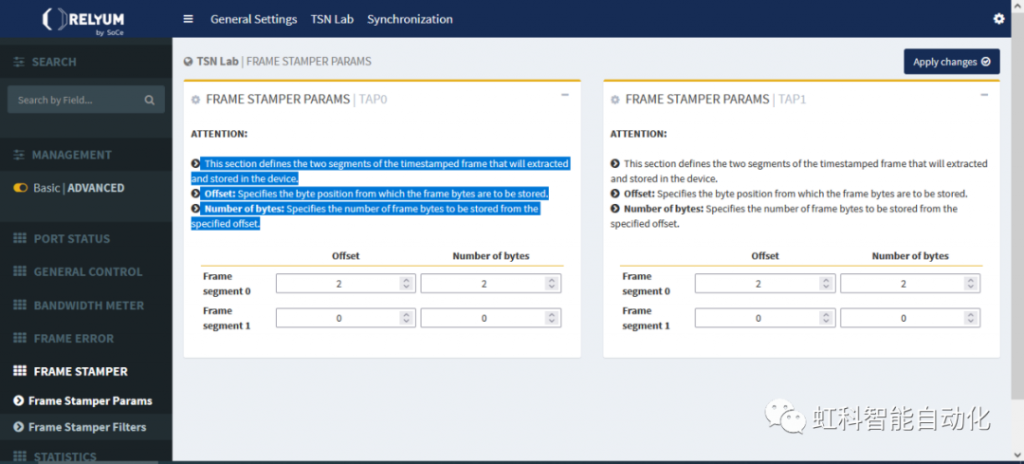
As shown in Figure 11, the two segments that define the timestamp frame that will be extracted and stored in the device. Among them, the offset is the byte position of the frame bytes to be stored, and the number of bytes is the number of frame bytes to be stored from the specified offset.
Similar to the bandwidth metering filter settings, as shown in Figure 12, the frame timestamp also has a filter setting, here directly check the box do not do any filter parameter settings to enable a global filter.
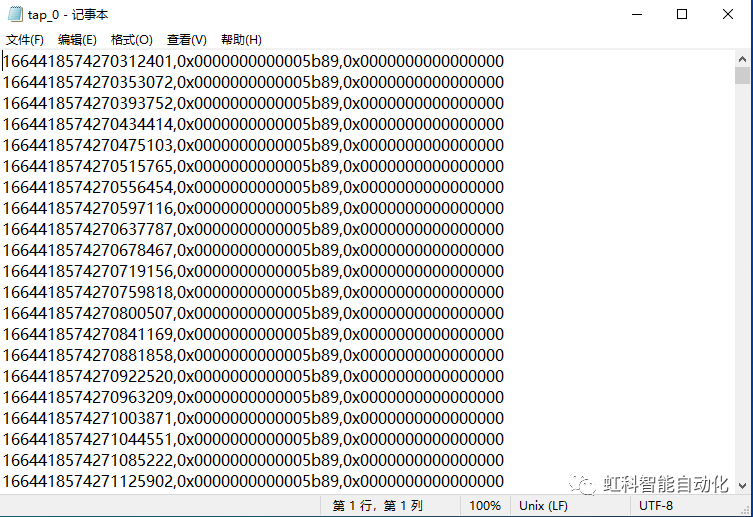
As shown in Figure 13, check “Frame timestamper enabled” to enable the delay calculation function of LAB. And click “Download capture life” below the TAP to start capturing frames with timestamp information. The Web page will download the file with .CSV extension, which is used to calculate the transmission delay of the network topology between TAP0 and TAP1.
As shown in Figure 14, TAP0 captured CSV file, the file has been set before the offset field of each frame, as well as in the beginning of this frame captured when the corresponding timestamp information, the same way TAP1 captured CSV file is also the same, delay the need to carry out the calculation of the information in the two files.
Contact Us